TechTool
» Statics 23
» Statics 22
» Statics 21
» Statics 20
» Statics 19
» Statics 18
» Statics 17
» Statics 16
» Statics 15
» Statics 14
» Statics 13
» Statics 12
» Statics 11
» Statics 10
» Statics 9
» Statics 8
» Statics 7
» Statics 6
» Statics 5
» Statics 4
» Statics 3
» Statics 2
» Statics 1

The World of Statistics – 5
By Dr. Magdi Abadir, PhD
Article – 5: The Central Tendency
1. A General Introduction
Getting back to the bored guy in the gathering who went through the employees’ data noting their age, we recall that he made a list of the age of 25 of them. Finally, he asked himself whether this gathering could be considered to be youthful or middle aged or even old?The answer to this question depends on several factors, one of which being the limiting age for each category, which is quite arbitrary. Another factor is the way to be used to make a safe guess about a "mean" age in order to properly answer the question.
Actually, there is more than one way in which a kind of mean age can be calculated. Each time a more or less different value can be obtained. This approach means looking for a typical value of age that would represent the whole population. This is called a "central tendency". Three typical means are usually used (although the list extends to much more than that). These are the arithmetic mean (or average), the median and the mode.
2. The Arithmetic Mean
This arithmetic mean, given the symbol for a population, consists of adding up all the values of the parameter (here the ages) and dividing by their number. Mathematically, it is expressed as follows:
In the present case, that would mean adding all the 25 ages of the persons present at the gathering and dividing by 25. Referring to the third article, this shows as follows:

This simple calculation becomes more intricate if the data are grouped as has been done in the same third article where ages were grouped in 10 years intervals. The following table illustrates these classes with the mean value of each class.
| Category | [20; 30) | [30; 40) | [40; 50) | [50; 60) | [60; 70) |
| Class mean | 25 | 35 | 45 | 55 | 65 |
| Frequency (f) | 5 | 8 | 7 | 4 | 1 |
To obtain a mean value from this table we have to multiply each frequency by the mean value of the class and add them up. The sum is then divided by the total frequency (25). This is mathematically expressed as follows:
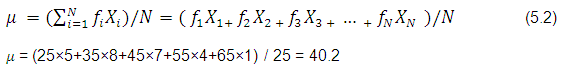
We note that the value obtained using grouped data differs slightly from the one obtained with ungrouped raw data. This latter is obviously more accurate as, in dealing with grouped data, we have assumed that the mean value of each class represents this class.
Although the arithmetic mean is a simple and representative measure of the whole population, it is sensitive to the presence of any odd values or “outliers”. For example, an instructor sets to obtain the mean value of the scores of 8 students in a quiz (out of 20) to get an idea about their standard. These showed as follows:
| 10 | 11 | 13 | 14 | 8 | 6 | 7 | 19 |
The mean value calculated for this group = 11 out of 20, which denotes an average standard. However, if the highest score is eliminated, the mean value decreases to 9.85, which indicates a weak group! This disadvantage can be overcome by eliminating the outlier, although the method used to do so is beyond the scope of that article. One simpler solution is to use another type of central tendency indicator such as the median or the mode.
Reference:
(1) Hoel P.G. (1976). "Elementary Statistics" 4th Ed., Reading, Mass.: Wiley Int. Edition, Chapter 2
More Readings:
(a) Magdi F. Abadir, Ph D (2019). Statistics, articles 1, 2, 3, 4. Optimanage.com.
| Dr. Magdi Fouad Abadir, Ph. D.: Dr. M. F. Abadir is currently a professor with the Chemical Engineering Department at the Faculty of Engineering, University of Cairo, Egypt. His major interests are in the fields of high temperature science and technology. During his career, he has supervised more than 110 MSc and PhD theses and published more than a hundred papers mostly in international peer review journals. He currently teaches courses in High Temperature Technology and Industrial Statistics. He is also a consultant for several industrial businesses. |