TechTool
» Statics 23
» Statics 22
» Statics 21
» Statics 20
» Statics 19
» Statics 18
» Statics 17
» Statics 16
» Statics 15
» Statics 14
» Statics 13
» Statics 12
» Statics 11
» Statics 10
» Statics 9
» Statics 8
» Statics 7
» Statics 6
» Statics 5
» Statics 4
» Statics 3
» Statics 2
» Statics 1

The World of Statistics - 1
By Dr. Magdi Abadir, PhD
The first question can be answered by applying the principles of probability, a major topic in statistical sciences. Put simply, the probability of 4 straight aces is about 0.00014, so, don’t bet on it! Also, if in a group of 18 kids, 5 are wearing glasses, then the probability of randomly choosing one kid wearing glasses will be: 5/18 (that is: 5 divided by 18).
As for the second situation, let us assume that the class consists of 10 students (This is known as population) and let the scores be: {7,6,7,5,9,10,7,7,9,10 }. The mean score is simply calculated by adding all scores and dividing by their number (that is: 10) … one gets an average score of 7.4. One can effectively notice that the scores approximately centered about that figure. The score (7) is the one that is mostly repeated. It is called the mode of the scores. Next, consider another class of 10 students with the following scores: {4,10,10,5,9,0,10,9,8,9 }. The mean score is still 7.7; however, we can “feel” that these scores are not “homogeneous” since some of them are too high and others too low. Theses scores are much more dispersed from the mean value than those of the first class. To quantify dispersion, a quantity known as the standard deviation must be calculated. Unfortunately, the method of calculation is too complicated to be – at present and in this article - put in simple terms. Nonetheless, its values for the two classes turn out to be 1.62 and 3.16 respectively, proving that the second distribution is much more dispersed than the first.
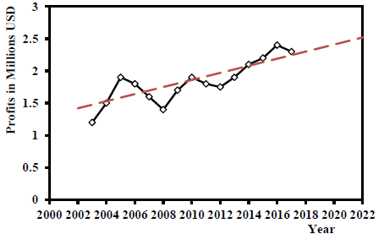
The third situation involves forecasting the profit out of available data. Let, for example, the company’s profits during the past 15 years (starting from 2003) be represented by the given broken line chart. To forecast the probable profit in 2022, a method known as linear regression is used. In this method, a hypothetical straight line is passed across the points, using certain rules. Once this line is plotted, one can forecast the probable figure for profits in that year. The forecasted figure is about 2.5 million USD (MUSD).
However, in applying that technique we need to specify the level of confidence of that prediction. For example, if we wish to ascertain that the forecast is correct to 95% precision, we can determine lower and upper limits for the expected profit in 2022. Calculations show that we can ascertain, with 95% confidence, that the minimum possible profit will be 1.8 MUSD while the maximum value will be 3.2 MUSD.
These three examples represent some common applications of statistical calculations. However, the scope is much wider and requires a lot more than the present concise exposé.
References:
1. D.C. Montgomery, G.C. Runger “Applied Statistics and Probability for Engineers” 3th ed., J. Wiley & sons, 2003.
2. Peck, Roxy; Chris Olsen; Jay L. Devore (2008). Introduction to Statistics and Data Analysis (3 ed.).
| Dr. Magdi Fouad Abadir, Ph. D.: Dr. M. F. Abadir is currently a professor with the Chemical Engineering Department at the Faculty of Engineering, University of Cairo, Egypt. His major interests are in the fields of high temperature science and technology. During his career, he has supervised more than 110 MSc and PhD theses and published more than a hundred papers mostly in international peer review journals. He currently teaches courses in High Temperature Technology and Industrial Statistics. He is also a consultant for several industrial businesses. |


