TechTool
» Statics 23
» Statics 22
» Statics 21
» Statics 20
» Statics 19
» Statics 18
» Statics 17
» Statics 16
» Statics 15
» Statics 14
» Statics 13
» Statics 12
» Statics 11
» Statics 10
» Statics 9
» Statics 8
» Statics 7
» Statics 6
» Statics 5
» Statics 4
» Statics 3
» Statics 2
» Statics 1

The World of Statistics and Probability
By Dr. Magdi Abadir, PhD
Article 17: An introduction to Probabilities - 3
3. The probability function
3.1 What is a function?
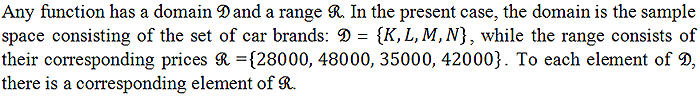
To start with, let us define the word “function”, widely used in mathematical analysis, in the context of probability. Let us have a sample space composed of 4 new car brands sold at a car dealer. Let them be denoted by K , L, M and N. The following table shows the corresponding price ($) of each item.| Item | K | L | M | N |
| Cost | 28000 | 48000 | 35000 | 42000 |
It is clear that the price of a car depends on its brand. The mathematical formulation of that result is to state that the car price is a function of its brand. This shows symbolically as follows:
| F(K) 28000 | F(L) 48000 | F(M) 35000 | F(N) 42000 |
(Note that the symbol commonly used for a function can be replaced by any other symbol such as or etc.)
Sometimes two elements of a domain may have the same corresponding value in the range. For example a fifth brand may cost $35000, in which case we have:
F(M) = F(S) 35000
However, one single brand cannot have two corresponding prices (at least at the same dealer since this is a new car, unless options are added) so that a function is defined as follows:
A function is a correspondence between elements in one set (domain) and elements of another set (range) such that to each element of the domain corresponds one single value in the range.
3.2 Definition of the probability function
In probabilities, the situation is very similar to that of the past example. Let us throw a “fake: dice so doctored that the probability of obtaining a 6 is highest. We assume the dice was thrown 100 times and the following frequencies recorded for each outcome:| Outcome | 1 | 2 | 3 | 4 | 5 | 6 |
| F | 14 | 11 | 12 | 13 | 15 | 35 |
In the present case, the domain is the sample space S ={1 ,2 ,3 ,4 ,5,6} while the range is the corresponding set of frequencies F ={14 ,11 ,12 ,13 ,15,35} so that if the defining function is denoted by,

Now, one can calculate the probability of getting any outcome on throwing the dice by dividing each outcome by 100, according to the simple concept presented in Section 1, Article 15. The following table is obtained, where the probability of each single outcome (or event) is denoted by P.
| Outcome | 1 | 2 | 3 | 4 | 5 | 6 |
| P | 0.14 | 0.11 | 0.12 | 0.13 | 0.15 | 0.35 |
This table represents the probability distribution of the random experiment consisting of throwing the said dice. It is customary to use the following mathematical representation to set a general form of that table with a sample space containing
 elementary events.
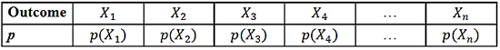
The values of the probability functions in the second row of that table should satisfy two conditions:

Reference:
W. Mendenhall, R. J. Beaver and B. M. Beaver “Introduction to Probability and Statistics” 14th Edition. Brooks – Cole, CENGAGE learning. (2013), Chapter 4
| Dr. Magdi Fouad Abadir, Ph. D.: Dr. M. F. Abadir is currently a professor with the Chemical Engineering Department at the Faculty of Engineering, University of Cairo, Egypt. His major interests are in the fields of high temperature science and technology. During his career, he has supervised more than 110 MSc and PhD theses and published more than a hundred papers mostly in international peer review journals. He currently teaches courses in High Temperature Technology and Industrial Statistics. He is also a consultant for several industrial businesses. |


