TechTool
» Statics 23
» Statics 22
» Statics 21
» Statics 20
» Statics 19
» Statics 18
» Statics 17
» Statics 16
» Statics 15
» Statics 14
» Statics 13
» Statics 12
» Statics 11
» Statics 10
» Statics 9
» Statics 8
» Statics 7
» Statics 6
» Statics 5
» Statics 4
» Statics 3
» Statics 2
» Statics 1

The World of Statistics (1)
By Dr. Magdi Abadir, PhD
Article – 10: The Central Tendency (6)
7. Concluding remarks regarding central tendency
In the past five articles, the concepts of the central tendency measures were detailed. The choice of any of these three measures (Mean, Median or Mode) to represent any distribution, is the culmination of this series of articles.The skewness of the distribution plays an important role in making a proper decision. To clarify this statement, let us check the following examples:
Case 1:
Consider the following distribution of scores in a 30-student class (with a maximum score of 100). To ease up calculations, the mid – class score was used instead of the class interval.| x | 15 | 25 | 35 | 45 | 55 | 65 | 75 | 85 | > 90 |
| f | 0 | 2 | 4 | 7 | 8 | 4 | 3 | 2 | 0 |
The skewness of that distribution = 0.164, implying the presence a slight positive tail.
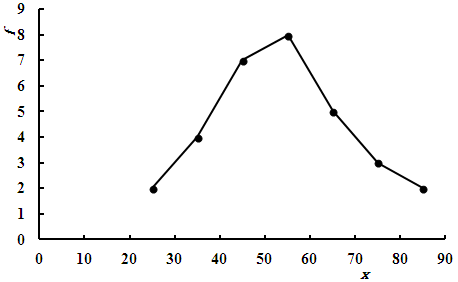
The values of distribution mean, median and mode were calculated respectively as 53.7, 55.0 and 52.5. The very fact that the distribution is almost not skewed is the reason behind the closeness of the three values. In that case, the mean best represents the distribution.
Case 2:
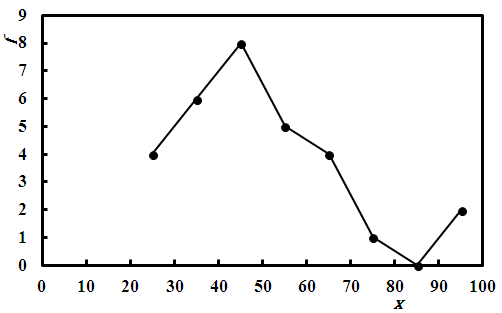
The following distribution relates to the scores of the same cohort in another course where the exam was a tough one, albeit the presence of two genius guys in that group that are classified as outliers.| x | 15 | 25 | 35 | 45 | 55 | 65 | 75 | 85 | > 90 |
| f | 0 | 4 | 6 | 8 | 5 | 4 | 1 | 0 | 2 |
Figure 2 reveals a strong positive skewness which was calculated as 0.9. On the other hand, the values of mean, median and mode are respectively 49.0, 45.0 and 43.33.
If now, the two extreme values, having scored more than 90, are discarded, the previous values become 45.7, 45.0 and 44.0, respectively.
This shows that the mean value is overly sensitive to outlier values while the mode has only been slightly affected and the median totally unaffected.
The conclusion that can be drawn from the previous discussion is that the use of the mean value is okay if the distribution is not overly skewed. In case of the presence of outliers that would yield a skewed distribution, it is preferred to use the median as it is not affected by the presence of such values. The use of the median is also recommended in case of ordinal variables, while that of the mode is usually restricted to dealing with non – numerical ordinal or nominal variables.
References:
(1) https://statistics.laerd.com/statistical-guides/measures-central-tendency-mean-mode-median.php
| Dr. Magdi Fouad Abadir, Ph. D.: Dr. M. F. Abadir is currently a professor with the Chemical Engineering Department at the Faculty of Engineering, University of Cairo, Egypt. His major interests are in the fields of high temperature science and technology. During his career, he has supervised more than 110 MSc and PhD theses and published more than a hundred papers mostly in international peer review journals. He currently teaches courses in High Temperature Technology and Industrial Statistics. He is also a consultant for several industrial businesses. |


