TechTool
» Statics 23
» Statics 22
» Statics 21
» Statics 20
» Statics 19
» Statics 18
» Statics 17
» Statics 16
» Statics 15
» Statics 14
» Statics 13
» Statics 12
» Statics 11
» Statics 10
» Statics 9
» Statics 8
» Statics 7
» Statics 6
» Statics 5
» Statics 4
» Statics 3
» Statics 2
» Statics 1

The World of Statistics (1)
By Dr. Magdi Abadir, PhD
Article – 8: The Central Tendency (4)
5. The mode
This is the easiest measure of central tendency which can be applied to any set of data, even if non-numerical. It represents the entity that recurs the greatest number of times in any set. For example, if we consider a distribution defined by the set of numbers:{3 ;5 ;6 ;5 ;7 ;2 ;3 ;5 ;9 ;5 ;3 ;1 ;2}, the number 5 recurs 4 times in that set. Since this is the maximum number of recurrences, then this number (5) is the mode of the distribution. On the other hand, In England, the mot recurring name is Smith. So, this can be considered as being the mode of all names in that country.In case of grouped data, the situation is more complicated. In that case, the mode is regarded as that value of the variable around which the other items tend to concentrate most heavily. It shows the center of concentration of the frequency in and around a given value.
Consider, for example, the distribution of particle size of particulate solids mentioned in the last article (7). The opening of the bottom pan that collects the finest cut is considered to equal 0.
| Size interval mm | 0– 0.074 | 0.074 – 0.147 | 0.147 – 0.295 | 0.295 – 0.417 | 0.417 – 0.590 | 0.590 – 0.834 | 0.834 – 1.180 | 1.180 – 1.668 |
| Mass g | 0.89 | 22.7 | 88.4 | 102.3 | 125.6 | 29.55 | 14.28 | 0 |
The bar chart corresponding to that distribution is shown in Figure (1).
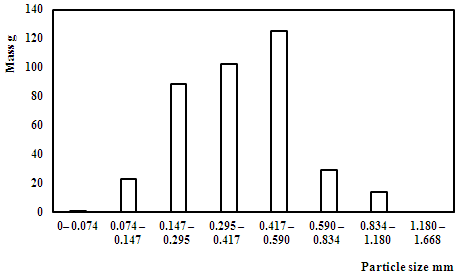
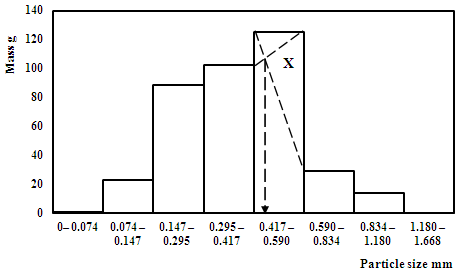
We note that the particle size range with the highest mass lies is in the range 0.417 – 0.59 mm. To get a more precise value, the gap between the bars is reduced to zero as in Figure (2). Then, we draw two segment lines, the first joins the upper left corner of the bar with highest mass (X) to the upper left corner of the bar to its right. The second line joins the upper right corner of the bar (X) to the upper right corner of the bar to its left. The intersection of the two segment lines represents the value of the mode. This value is about 0.45.
Reference:
(1) https://tutors4you.com/modegraphically.htm
| Dr. Magdi Fouad Abadir, Ph. D.: Dr. M. F. Abadir is currently a professor with the Chemical Engineering Department at the Faculty of Engineering, University of Cairo, Egypt. His major interests are in the fields of high temperature science and technology. During his career, he has supervised more than 110 MSc and PhD theses and published more than a hundred papers mostly in international peer review journals. He currently teaches courses in High Temperature Technology and Industrial Statistics. He is also a consultant for several industrial businesses. |